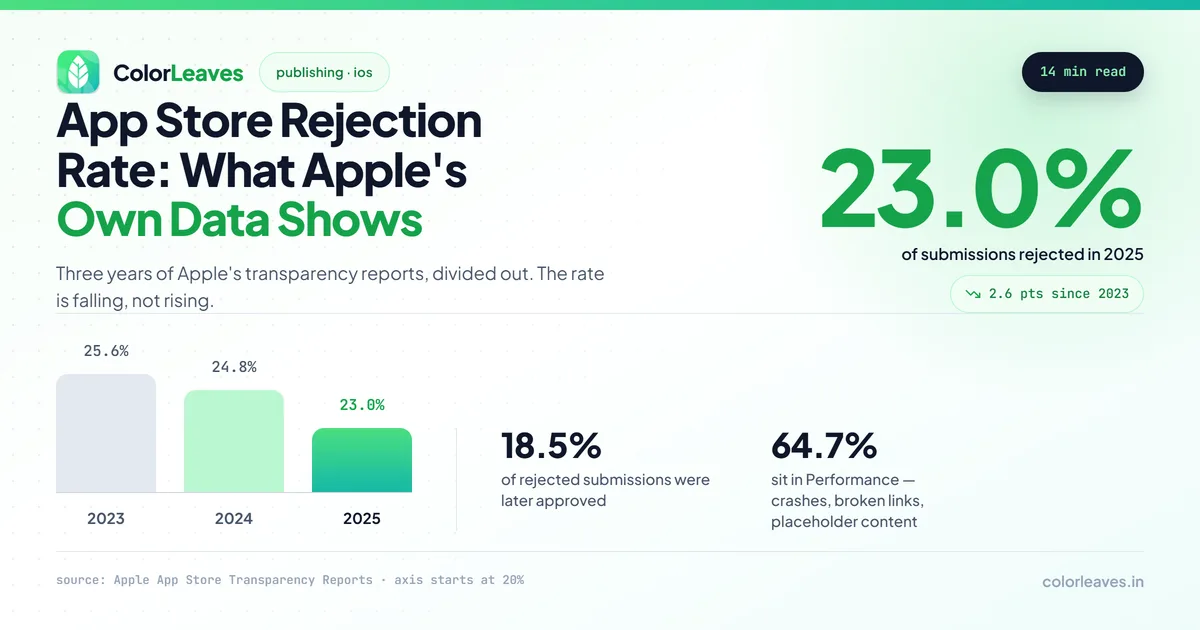
Apple rejected 2,093,244 of 9,100,620 App Store submissions in 2025, a rejection rate of 23.0%. That is down from 24.8% in 2024 and 25.6% in 2023, which is the opposite of what most people assume is happening.
We pulled the figures from Apple’s own App Store Transparency Reports rather than from anyone’s summary of them, computed the rate for each year, and checked whether Google publishes anything comparable. It does not, and that turns out to be the more useful finding.
If you want the guidelines behind the numbers rather than the numbers themselves, our companion piece on why apps get rejected covers the specific rules. This one is about what the aggregate data supports, and about which widely repeated figures are not supported by anything.
Key Takeaway: Roughly one in four App Store submissions is rejected, and the rate has fallen for two consecutive years while submission volume grew 32%. Around 18.5% of rejected submissions were later approved, so a rejection is a delay rather than a verdict. Nobody can honestly quote a Google Play rejection rate, because Google publishes how many apps it blocks but never how many it reviewed.
The Three Year Trend
Apple has published a transparency report for each of the last several years. Each one states both figures needed to compute a rate: total submissions reviewed, and total rejected. Very few write-ups actually divide one by the other.
| Year | Submissions reviewed | Rejected | Rejection rate |
|---|---|---|---|
| 2023 | 6,892,500 | 1,763,812 | 25.6% |
| 2024 | 7,770,000 | 1,930,000 | 24.8% |
| 2025 | 9,100,620 | 2,093,244 | 23.0% |
Two things stand out.
Submissions grew faster than rejections. Volume rose 32% between 2023 and 2025, from 6.89 million to 9.10 million. Rejections rose only 18.7% over the same period. Whatever else is happening, App Review is not tightening in the way the general commentary suggests.
The rate is falling steadily. Down 0.8 points in 2024, then a further 1.8 points in 2025. Apple has said it now uses machine learning alongside human reviewers, and the direction of travel is consistent with better tooling catching fewer false positives, though Apple does not break the figures down in a way that proves that.
If you are budgeting risk for a launch, the working number is roughly one in four, and it has been slightly better each year.
First submissions carry more of that risk than updates do, simply because everything is being seen for the first time. If you are costing a first version, treat review as a line item with a probability attached rather than as a formality at the end of the build.
Rejections Are Not Final
The number almost nobody quotes sits in the same reports.
| Year | Rejected | Approved after fixing the issue | Share recovered |
|---|---|---|---|
| 2024 | 1,930,000 | 295,109 | 15.3% |
| 2025 | 2,093,244 | 387,087 | 18.5% |
Nearly one in five rejected submissions came back and was approved, and that share is rising. A rejection costs you a review cycle, not the launch.
This matters for how you plan. Teams that treat App Review as a pass or fail gate build in no contingency and then panic. Teams that treat it as a round trip build a week of slack into the schedule and ship on time. Our development timeline guide covers where that slack belongs relative to everything else.
Worth being precise about what these figures do not cover. The recovery number counts submissions that were rejected and later approved. It does not tell you how many attempts that took, or how long each one added.
Performance Causes Two Thirds of Rejections
Apple breaks 2025 rejections down by guideline category:
| Category | Rejections | Share of all rejections |
|---|---|---|
| Performance | 1,354,418 | 64.7% |
| Legal | 495,673 | 23.7% |
| Design | 415,532 | 19.9% |
| Business | 283,820 | 13.6% |
| Safety | 151,159 | 7.2% |
| Other | 4,145 | 0.2% |
Those percentages add up to considerably more than 100, and that is not an error in the arithmetic. The categories total 2,704,747 against 2,093,244 actual rejections, which means the average rejected submission breaks 1.3 guidelines at once.
That is a practical finding. Fixing the one thing the reviewer mentioned is often not enough, because roughly a third of rejections carry a second problem that surfaces on resubmission. It is cheaper to audit against the whole guideline set before you resubmit than to discover the second issue three days later.
Performance dominating at 64.7% is also worth sitting with. Guideline 2 covers crashes, bugs, broken links, placeholder content and incomplete information, which are the failures that a proper pre-submission pass catches. This is not a category full of judgement calls. It is mostly the category of things nobody checked.
What Each Category Actually Contains
The category names are Apple’s and they are less obvious than they look. Here is what sits behind each, and where we most often see teams caught.
Performance, 64.7%. Crashes, bugs, broken links, placeholder content, incomplete information, and apps that reviewers could not fully use. A large share of this is not exotic. It is a reviewer hitting a crash on a device or an OS version the team never tested, which is the same problem as Android device fragmentation arriving on the other platform. Incomplete reviewer notes belong here too, and they cost a full cycle for something that takes five minutes to write.
Legal, 23.7%. Privacy policy problems, data collection that does not match what is declared, and regulatory requirements attached to specific business types. Anything financial or medical carries obligations here that generic advice never mentions, and our guides on fintech and healthcare builds cover where those differ by market.
Design, 19.9%. Guideline 4, which includes minimum functionality, the Sign in with Apple requirement, and interfaces that copy platform conventions badly. This is the most judgement-dependent category, and it is where a proper design pass pays for itself, because the fixes are expensive once the app is built.
Business, 13.6%. Mostly in-app purchase. Selling digital content outside Apple’s system, or routing users to an external checkout, or implementing in-app purchase for physical goods where it does not belong. Ecommerce and on-demand products tend to get this wrong in the cautious direction.
Safety, 7.2%. Objectionable content, user-generated content without moderation, and the requirements around apps aimed at children. Any product where users can post to each other needs moderation, reporting and blocking before it will pass, which catches property and education apps that never considered themselves social.
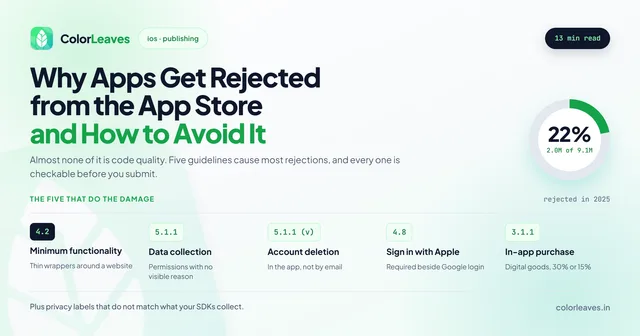
Our write-up on why apps get rejected from the App Store goes through the specific guidelines these map to.
Nobody Can Quote a Google Play Rejection Rate
Here is the finding we did not expect.
Search for a Google Play rejection rate and you will find a figure, usually around 8%, repeated across agency blogs and app development sites. We went looking for its source and could not find one, so we went to Google’s own reporting.
Google’s annual Android and Google Play safety post for 2025 gives:
| Figure | Value |
|---|---|
| Policy-violating apps prevented from publishing | 1,750,000 |
| Bad developer accounts banned | 80,000 |
| Apps blocked from excessive sensitive data access | 255,000 |
| Safety checks run on every published app | 10,000+ |
| Total submissions reviewed | not published |
Google publishes the numerator and not the denominator. Without a total submission count there is no rejection rate to calculate, so any percentage you see quoted for Google Play is derived from something other than Google’s published data.
That is not a small distinction if you are comparing the two stores. Apple’s 1.75 million versus Google’s 2.09 million looks like a fair comparison and is not one, because we know Apple reviewed 9.1 million submissions and we have no idea what Google reviewed. The two numbers are similar in size and mean different things.
The honest version is that Apple’s process is measurable and Google’s is not. Anyone telling you Play is three times easier to get into is inferring it.
What can be said without a rate attached is that the two processes differ in kind. Apple’s is predominantly human with machine assistance and runs in days. Google’s is predominantly automated with spot human checks and usually runs in hours. Our practical experience matches the widespread impression that Play is the easier gate, we just cannot put a number on it and neither can anyone else. If you are still choosing where to launch first, Android or iOS works through the decision on revenue rather than on review difficulty, which is the right basis.
One asymmetry worth planning around regardless. Google’s enforcement is heavily weighted toward account-level action, with 80,000 developer accounts banned in 2025. Apple rejects submissions; Google is comparatively more willing to remove the developer. That makes owning your own Play Console account and your own Apple Developer account a risk control rather than an administrative preference, because an account-level action against a vendor who publishes several clients’ apps takes yours down with it.
What This Means If You Are Shipping
Budget a review cycle, not a review. One in four submissions is rejected and nearly one in five rejections is later approved. A launch plan with zero slack between submission and announcement is a plan that assumes you land in the 77%.
Audit against the whole guideline set, not the rejection notice. At 1.3 violations per rejection, the reviewer’s note is frequently incomplete rather than wrong.
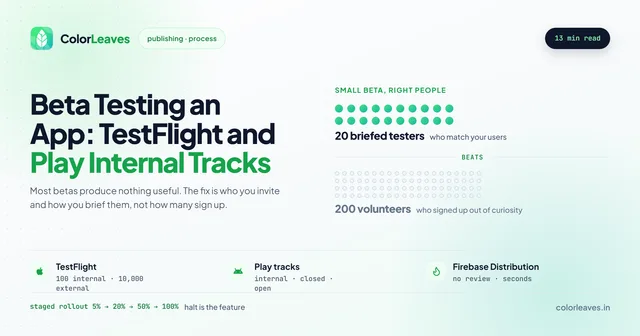
Spend your pre-submission time on Performance. It is where two thirds of rejections come from and the least judgement-dependent category to fix. Crashes, broken links, placeholder content and incomplete metadata are all checkable before you submit. Running the build through TestFlight and Play internal testing first catches most of it.
Do not plan against Apple’s headline review time. Apple’s developer page states that 90% of submissions are reviewed in under 24 hours. Submission confirmation emails have quoted a different split, around 50% within 24 hours and over 90% within 48. Both may be accurate for different periods, but a percentile is not a commitment, and health, finance and kids category apps routinely sit longer.
Treat store rejection as an offshore-specific risk if your team is offshore. A rejection lands on Apple’s schedule in Pacific time. If your development team is in India, the response window falls in their night, and a rejection that could have been answered in two hours instead costs a day. This is one of the arguments for overlapping working hours that has a number attached to it rather than a feeling, and it is on our list of offshore risks for that reason.
Agree who pays for a rejection before it happens. At a one in four rate this is not a hypothetical clause. Fixing a rejection should sit inside the engagement rather than arriving as a change request, which is the kind of thing our contract checklist exists to settle in advance.
Turning the Rate Into a Schedule
The arithmetic is simple enough to do on the back of an envelope, and doing it changes how launches get planned.
Take a single submission. There is roughly a 77% chance it clears, and Apple’s own figures put most decisions inside 24 to 48 hours. So the good case is two days.
Now take the 23% case. You get the rejection, you fix it, you resubmit, and you wait again. Realistically that is a day to understand and fix, plus another review cycle. Call it three to four days added, more if the fix is a product change rather than a code change, and considerably more if your team’s working day does not overlap with the moment the rejection arrives.
Weight those together and the expected cost of getting through review is somewhere near three days, with a tail that runs to a week or more. A launch plan that allocates two days is planning for the median and ignoring the distribution.
Our recommendation to clients is a full week between final submission and any announced date, and two weeks for anything in the health, finance or kids categories where longer reviews are common. That sounds conservative until the first time you need it.
The same logic applies to updates, which people forget. Guidelines change, and an update can be rejected against a rule that did not exist when the app first shipped. Account deletion caught a lot of live apps this way. Whoever handles your ongoing maintenance needs the same slack in their release cadence that the original launch had.
Methodology
Every figure above comes from a primary source, not from another article quoting one.
- Apple submission and rejection counts, category breakdowns and recovery figures: Apple’s App Store Transparency Reports for 2025, 2024 and 2023, published annually by Apple Legal.
- Google enforcement figures: Google’s Keeping Google Play and Android app ecosystems safe in 2025, published February 2026 on the Google blog.
- Review time statements: Apple’s App Review page for developers.
Rejection rates are our calculation, dividing rejected submissions by total submissions reviewed in the same report. Apple does not publish the rate itself. Category shares are calculated against total rejections in the same year, which is why they sum above 100%.
Two limits worth stating. Apple’s figures cover submissions, not distinct apps, so a single app rejected three times counts three times. And these are global numbers, so nothing here tells you whether a rate differs by category, region or developer size, because Apple does not publish that cut.
Compared With What You Have Been Told
Most of what circulates about app store rejection is either a single year’s number quoted without its denominator, or a top-ten list of guidelines rewritten from Apple’s own documentation. Neither tells you whether the situation is getting better or worse, and neither gives you anything to plan against.
The three year picture is more useful and slightly more reassuring than the commentary suggests. Rejection is common, it is getting marginally less common, most of it is caused by things you can check yourself before submitting, and most of it is recoverable.
That last point is the one worth carrying away. Two thirds of rejections sit in a category that is mostly unchecked work rather than disputed judgement, which means the rate is more within your control than the headline suggests. Our step by step guide to building an app covers the checks that belong before submission, and none of them are expensive.
We publish this because we would rather clients plan against real numbers than against launch-day optimism. If you want the numbers behind a specific build rather than the industry aggregate, our app publishing cost breakdown covers what a submission actually costs to get through, and the full development process covers where the weeks go before you ever reach review.
The practical test of any development partner on this is whether they can tell you their own rejection history without checking. Anyone submitting regularly knows it. It is a more useful question than most of the ones on a standard vendor questionnaire, and it belongs alongside the others in choosing a development company. We build iOS apps from India and from Pune, and StockGenie is a finance app that went through both stores and is live with a 4.5 rating.
If you have a submission coming and want the pre-submission audit run against it, send us the details.
Figures current as of August 2026, covering calendar years 2023 to 2025. We will update this when Apple publishes its 2026 report.